Gold and Silver: Silver falls to a new low of $22.00
During the Asian trading session, we watched the gold price pull back from the $2030 level.
During the Asian session, we watched the price of silver pull back from the $22.60 level.
Gold chart analysis
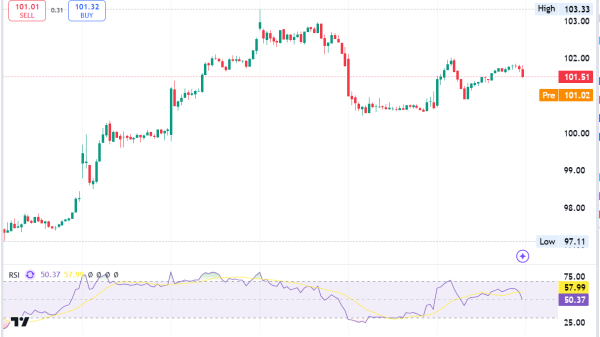
During the Asian trading session, we watched the gold price pull back from the $2030 level. We had additional resistance in that zone in the EMA200 moving average, which led to a pullback, and now the gold price is at the $2020 level. Here, we are testing the previous day’s low, and a new breakout could lead to a breakout below and the formation of a new low. Potential lower targets are $2015 and $2010 levels.
Last week’s low price of gold was at the $2001 level. We need positive consolidation and a return around the $2030 level for a bullish option. We would again be in a situation to test the EMA200 moving average. A break above means that the price has the strength to initiate a further recovery to higher levels. Potential higher targets are $2035 and $2040 levels.
Silver chart analysis
During the Asian session, we watched the price of silver pull back from the $22.60 level. The bearish impulse is very strong and brought us down to the $22.00 level. Hopefully, we can get some support here and stop this price drop. If the price of silver continues to weaken and remain under pressure, a drop below is inevitable. Potential lower targets are $21.90 and $21.80 levels.
We need a positive consolidation and a move above the $22.20 level for a bullish option. There, we would form a new bottom from which the price of silver would have the opportunity to start a new recovery. Potential higher targets are $22.40 and $22.60 levels. The EMA200 moving average is in the zone around the $22.80 level. For three weeks now, we have failed to break above it and maintain it stably in order to start a bullish trend.
The post Gold and Silver: Silver falls to a new low of $22.00 appeared first on FinanceBrokerage.


