S&P 500 and Nasdaq: S&P 500 above 5440.0 for first time
On Wednesday, the S&P 500 reached a new all-time high at the 5446.9 level.
On Thursday, the Nasdaq index rose to 19657.2 levels, a new all-time high.
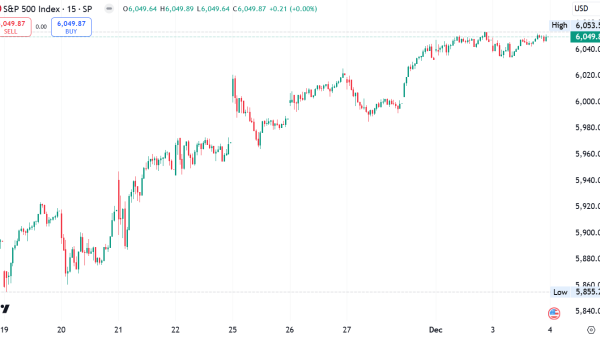
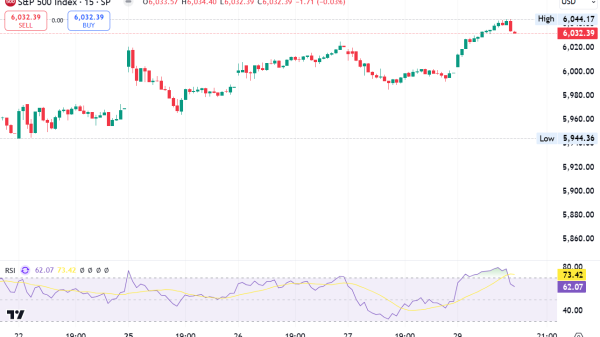
S&P 500 chart analysis
On Wednesday, the S&P 500 reached a new all-time high at the 5446.9 level. After that, the index has since moved in the 5410.0-5440.0 range. During this morning’s Asian trading session, we saw an attempt to test the weekly high but stopped at the 5437.0 level. From there, a bearish consolidation was initiated, which is still current. We are now at the 5400.0 level and are still leaning toward the bearish side.
Potential lower targets are 5390.0 and 5380.0 levels. Additional support for the S&P 500 index is the EMA200 moving average in the 5370.0 zone. We need a new positive consolidation and a return above 5420.0 for a bullish option. There, we are back above the EMA50 moving average. With its support, it will be easier for us to get back above the 5430.0 daily open price. Potential higher targets are 5440.0 and 5450.0 levels.
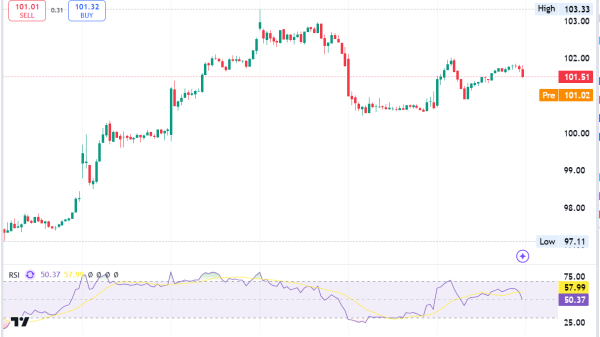
Nasdaq index chart analysis
On Thursday, the Nasdaq index rose to 19657.2 levels, a new all-time high. During this morning’s Asian trading session, we saw a bullish attempt to climb to a new high but stopped at the 19635.0 level. A pullback has been initiated from that level to 19500.0, where we encounter the EMA50 moving average. We remain above him for now and manage to stay there.
If the bearish pressure continues, we could fall below a new daily low. Potential lower targets are 19400.0 and 19300.0 levels. We need a positive consolidation and a return above 19600.0 for a bullish option. Thus, we return above the daily open price to the positive side. Potential higher targets are 19700.0 and 19800.0 levels.
The post S&P 500 and Nasdaq: S&P 500 above 5440.0 for first time appeared first on FinanceBrokerage.


